How CricketX Turns Every Batting Session Into a Training Plan
Introducing Batting Analysis in CricketX: explore an in-game report, follow a delivery-level pattern, and turn it into focused practice.
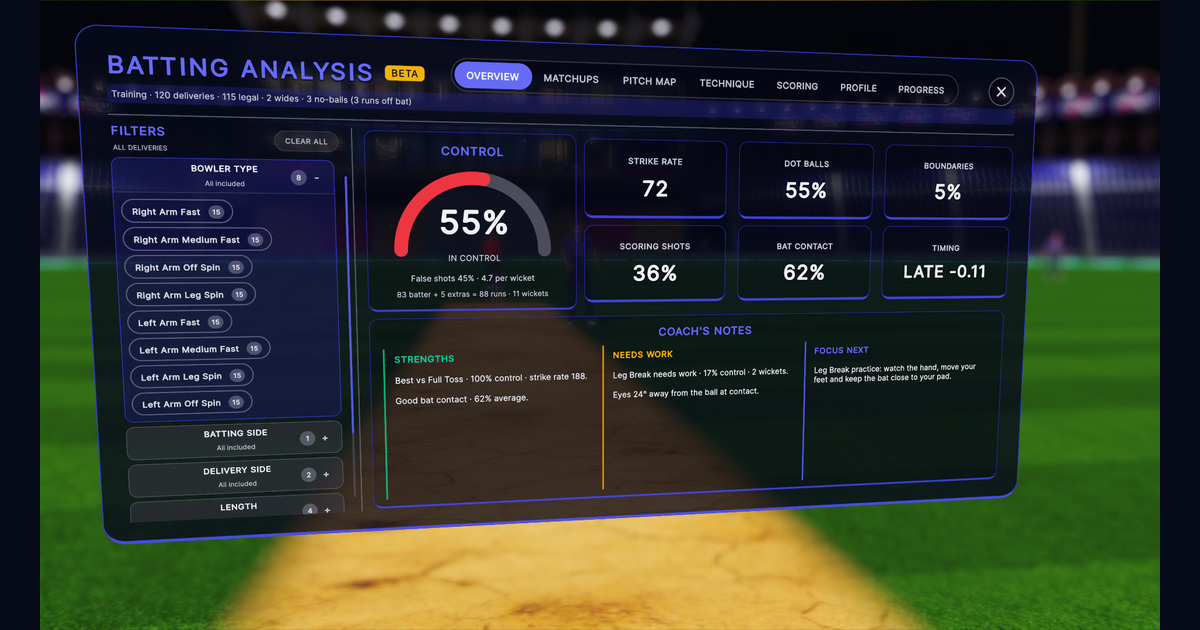
A batting session can tell you more than its final score. Batting Analysis is the in-game report for looking back at the deliveries you faced and finding what to work on next.
The new two-minute walkthrough below starts on the ground, opens the full report and follows a controlled demonstration through its matchups, pitch map, technique and progress. The sections after it explain the numbers and views in more detail.
Detailed Batting Analysis connects every delivery with its bowler, speed, length, outcome, bat contact, timing and player movement. You can start with the full session, find a weak area, and keep narrowing the data until you understand what needs to improve.
A two-minute look at the in-game report, from a controlled demonstration session to a clearer practice question.
#It starts with every ball you played
The walkthrough uses a controlled demonstration session of 120 deliveries: 115 legal balls, two wides and three no-balls. The no-balls also include three runs from the bat.
That line at the top of the interface matters. Percentages such as strike rate and control need to use the correct legal-ball count, while wides and no-balls still belong to the complete session record.
Each delivery stays connected to the information CricketX already had while it was being played:
- Bowler type
- Batting side
- Delivery side
- Length
- Speed
- Outcome
- Ball landing position
- Bat contact and swing timing
- Headset movement and viewing direction
This is the foundation of the whole report. You are not looking at separate numbers that happen to come from the same session. You are looking at the same deliveries from different angles.
So when the report shows a problem, you can investigate it instead of guessing.
#First, understand the full session
Overview gives you the quickest answer to a simple question: how did this session go?
Control shows how often the batter stayed in control of the shot. A legal-ball miss, an OUT, poor contact or a badly mistimed swing lowers it. It is not a label for “safe” shots, and it is not another name for dismissals. It combines the parts of a delivery that show whether the batter controlled the bat and the result.
The other cards show:
- Strike rate
- Dot-ball percentage
- Boundary percentage
- Scoring-shot percentage
- Bat contact
- Swing timing
These numbers answer different questions. Strike rate shows scoring speed. Bat contact shows how often the bat met the ball. Timing shows whether contact was early or late. One good number cannot hide every other problem.
The lower panel turns the report into Strengths, Needs Work, and Focus Next. These notes come from the current session. Their purpose is not to praise or criticise the player. Their purpose is to give the next practice a clear starting point.
That is the real value of Overview. It does not leave you with “55% Control” and expect you to decide what that means. It shows you where to look next.
#Use filters to find the real problem
Filters apply to the whole report, not only the open tab.
You can narrow the session by bowler type, delivery side, length, speed or outcome. Training sessions can also be separated by batting side. CricketX only shows filter options that actually exist in the session, so the player is not searching through empty categories.
The controlled session in the video gives a simple example:
- Across the full session: 55% control and a strike rate of 72.
- Against right-arm fast bowling: 80% control, a strike rate of 147, and no OUTs.
- Against right-arm leg spin: 47% control, a strike rate of 7, and two OUTs.
The full result says the session needs work. The filtered result says something much more useful: pace was handled well, while leg spin caused a clear problem.
The player can keep narrowing it. Select deliveries at 120 kilometres per hour and above to study faster bowling. Select Good Length to study one landing area. Combine filters when the question needs to be more exact.
Every other tab follows those active filters. This means the same leg-spin problem can be inspected through Matchups, Pitch Map, Technique, Scoring, Profile and Progress without losing the selected deliveries.
This is the point where broad feedback becomes a specific training target.
#See which deliveries changed the result
Once you have found a weaker area, Matchups helps explain what created it. It starts with a direct pace-versus-spin comparison and places strike rate, Control, boundaries and OUTs together.
The lower panel then provides four comparison views.
#Bowler
Bowler compares every bowling style faced in the session. It is the clearest place to see whether the batter performed differently against right-arm pace, left-arm pace, off spin, leg spin or another available type.
#Delivery
Delivery compares the actual ball types that appeared, such as leg breaks, yorkers, full tosses and top spinners.
Two bowlers can belong to a similar category while asking very different questions of the batter. This view moves the analysis closer to the delivery that caused the result.
#Length
Length compares where the deliveries pitched: yorker, full, good length, short, or any other length present in the session.
This helps separate a bowling-style problem from a landing-area problem. The batter might be comfortable against leg spin in general but struggle when it lands on a good length.
#Speed
Speed compares pace ranges, from slower deliveries to more than 140 kilometres per hour.
It shows whether control, scoring or OUTs changed as the pace increased. Because the same filters remain active, the batter can study speed across the whole session or only against one bowler type.
These are not four unrelated charts. They help you move from “I struggled against spin” to something you can actually practise, such as “good-length leg breaks reduced my Control and produced two OUTs.”
The closer the report gets to the exact delivery, the easier it becomes to build the right drill.
#Put the weakness back on the pitch
Pitch Map places the analysis back on the pitch.
In Control view, every zone shows the percentage of legal balls played in control from that landing area. Every dot is a delivery. Every marked OUT is a real wicket from a ball that landed there.
Those OUT markers are important. They are not general warnings and they are not every false shot. They show the landing positions of deliveries that actually ended in a wicket.
The panel on the right groups those OUTs by length, pace or spin, and delivery type. The map shows where the problem happened. The breakdown helps explain what produced it.
Open Strike Rate and the same pitch zones show runs scored per 100 legal balls. A zone can have good control but weak scoring, or quick scoring with poor control. Looking at both views prevents one number from hiding the trade-off.
Together, the views answer two practical questions:
- Where did the batter lose control?
- Where was the batter able to score?
Now the next practice can be built around a real location and delivery type. A weak good-length area against leg spin is much easier to practise than a vague instruction to “play spin better.”
#Check what happened in your technique
Two shots can finish with the same result for very different reasons. Technique looks at the movement behind the outcome.
#Ball Tracking
Ball Tracking measures the angle between the player's viewing direction and the ball at contact. A larger angle means the ball was farther away from where the player was looking when the bat met it.
This does not try to replace a coach's judgement. It gives the player a repeatable measure of whether the ball remained in view through contact.
#Head Discipline
Head Discipline shows head drift and the horizontal distance between the head and the ball.
These are related but different. A batter can keep the head fairly still and still finish too far away from the ball. The two measures make that difference visible.
#Swing Timing
Swing Timing shows whether contact happened early or late. The demonstration session contains many early swings, which gives the player something specific to work on rather than only seeing the final scoring result.
#Bat Contact
Bat Contact measures how well the ball met the bat. A swing can make contact and still be poorly middled. This view separates simply hitting the ball from hitting it cleanly.
In the demonstration report, head movement and position are reasonably strong, while ball tracking and early timing need more attention. Instead of trying to rebuild the whole batting technique, the player leaves with two focused areas to work on.
The data does not replace a coach. It gives the player and coach repeatable evidence they can use together.
#Understand what your shots produced
Scoring contains two connected views.
The Wagon Wheel uses the real direction and distance of each legal-ball result. Scoring shots extend into the field. Misses, leaves and bowled balls remain near the stumps because the ball did not travel as a scoring shot.
The Delivery Outcomes panel separates dots, singles, twos, threes, fours, sixes, OUTs, wides and no-balls.
The wagon wheel shows where. Delivery Outcomes shows what happened.
Together, they can reveal whether the next session should focus on placement, strike rotation or boundary scoring. They can also show that a high strike rate came from one scoring area rather than control around the full field.
#See the complete shape of your batting
Profile condenses the session into six batting traits.
- Control uses the same control result explained earlier.
- Timing measures how close contact came to the moment of peak bat speed.
- Power uses bat speed at contact.
- Intent uses scoring rate to show how actively the batter scored.
- Placement measures the spread of scoring directions.
- Watching uses the angle between the player's viewing direction and the ball.
The radar chart makes the overall shape easy to read. It might show strong timing and placement beside weaker watching or control. The detail remains available in the earlier tabs, but Profile makes the balance visible in one place.
The panel on the right shows control at each difficulty level. That prevents a strong overall number from hiding a large drop when the session became harder.
Profile gives you the summary. The earlier views give you the evidence behind it.
#Measure whether the practice is working
Finding a weakness only matters if you can check whether it improved. In Training mode, Progress follows your performance as the session continues.
Control is a rolling percentage over the latest 12 legal balls. It reacts to improvement and sudden drops instead of flattening the whole session into one average.
Runs is the cumulative team total after each legal ball, with extras included.
Contact is the rolling average of contact quality across the same 12-ball window. Misses are excluded from the contact calculation, because this graph measures the quality of contact when contact happened.
The active filters also apply here. Filter the report to leg spin first and Progress becomes a chart of the leg-spin drill. Filter it to Good Length or faster bowling and the graph follows that question instead.
This closes the training loop. Make an adjustment, face the delivery again, and see whether the result changes.
#Match-style modes follow the innings
Training mode uses Progress. In Chase and other over-based modes, the report opens Overs instead.
Runs per Over groups the score into blocks of six legal balls and includes extras.
Trend shows those over totals as a line, making strong and weak overs easier to compare.
Worm keeps a cumulative total after every over, showing the scoring journey across the innings.
These views connect the technical report with match rhythm. A player can see not only how a delivery was played, but also how control and scoring developed across an over-based challenge.
#Turn the report into the next session
The best use of Detailed Batting Analysis is a simple loop:
- Play a session.
- Use Overview to find the strongest and weakest areas.
- Apply filters to isolate the problem.
- Use Matchups, Pitch Map and Technique to understand what caused it.
- Build the next practice around that exact situation.
- Return to Progress or Overs to measure what changed.
For the demonstration session, that could mean filtering right-arm leg spin, checking which lengths caused the two OUTs, reviewing ball tracking and early swing timing, then practising those deliveries again.
The instruction is no longer “face more spin.” It is clear, testable, and connected to the next report.
#What VR adds to the training
Traditional net practice remains valuable. It provides real bowling, a physical environment and direct coaching that a simulator should not pretend to replace.
VR adds something different: the system already knows the delivery that was sent, where it landed, how the virtual bat moved, where the headset was facing, what contact occurred and how the ball finished.
Collecting the same connected record in a normal practice session can require several cameras, sensors, radar, careful notes and time spent joining the information afterwards. Inside the simulation, those events can be measured together and the same problem can be repeated on demand.
That is what turns a session into more than time spent facing deliveries. You can see what worked, find what held you back, and return with a clear plan to improve it.
CricketX is live on Meta Quest.